User Guide
95% interval
As we saw from the averages calculation, it is rarely possible to calculate the exact distribution average because we do not know the distribution function. It is simply possible to estimate the average with the following calculation:
Because this calculation is an approximation, you just need to know the approximation's precision. Generally, to characterize the approximation's precision we calculate the 95% interval. This interval corresponds to:
***95% interval = the interval in which there is a 95% chance that the true value of the distribution average is found inside. ***
This interval is calculated in the following way:
With:
- mu: Estimated average value of the distribution
- sigma: Estimated standard deviation value of the distribution
- n: Number of values in the series
- t: The inverse student distribution at 2.5% for n degrees of freedom. For the first approximation we can take t=2
The width of the confidence interval therefore depends on the standard deviation of the distribution of the number of values in the series. The higher the number of values the more the confidence interval will be reduced.
Example :
Let us take the following data set:
 .
.
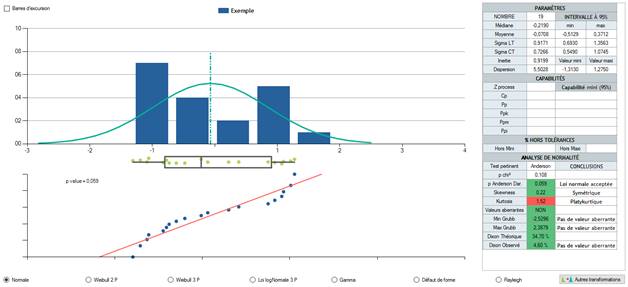
The calculated average value is of -0.0708.
There is a 95% chance that the true average value of the sample distribution is between -0.05129 and 0.03712.