User Guide
Calculating percentages outside of tolerance
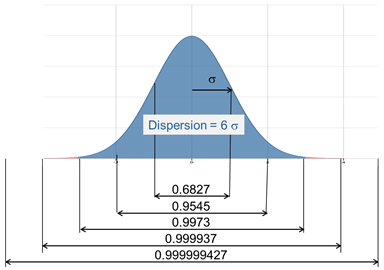
When defining the properties of normal distribution we saw that they are perfectly defined when we know their average and standard deviation. In particular we know that:
We can go further in order to calculate the percentage of a population outside of tolerance by simply calculating the z number.
The z number represents: the precise standard deviation from the mean value within the sample tolerance.
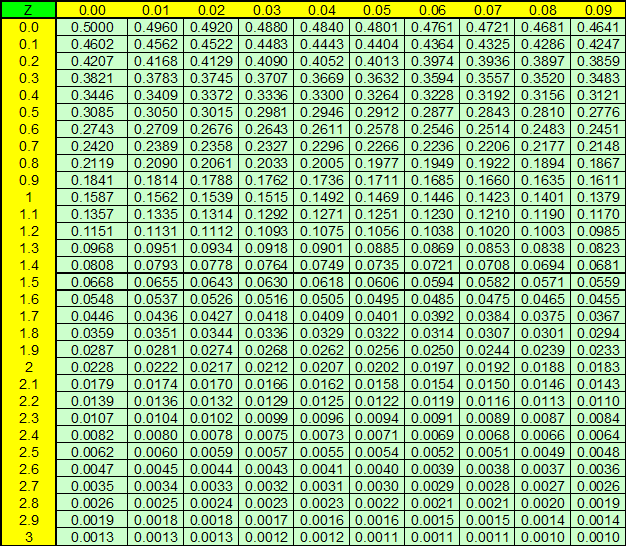
Once we know the z number we can calculate the off-tolerance percentage by using the Gaussian table.
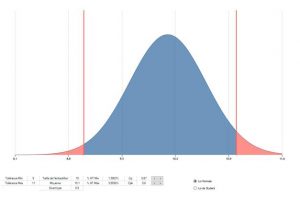
Let us take the following example:
Let us calculate zmin :
We deduct the percentage of parts outside of tolerance min in the Gaussian table:
%HTmin=1.39%
Let us calculate zmax :
We deduct the percentage of parts outside of tolerance min in the Gaussian table:
%HTmin=3.59%