User Guide
Centering the Ppk procedure
Calculations of the Cp and Pp do not take into account the process variability or procedure centering. Indeed, the following figure shows that the two processes have a Pp of 1.6.
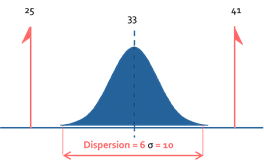
It is clear that the lower process creates more off-tolerance parts than the left hand process. Yet, this is not seen in the pp calculation because, for the two processes, we have:
It is therefore appropriate to introduce a new indicator, the Ppk. The Ppk corresponds to the true procedure performance and is calculated in the following way:
Let us take the following example:
In this case:
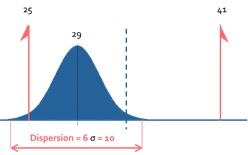
Let us take the following example:
In this case:
The Ppk makes it possible to differentiate the two processes.
In the same way, the Cpk can be calculated, which is the equivalent of the Ppk but uses short term variability.