User Guide
Control chart
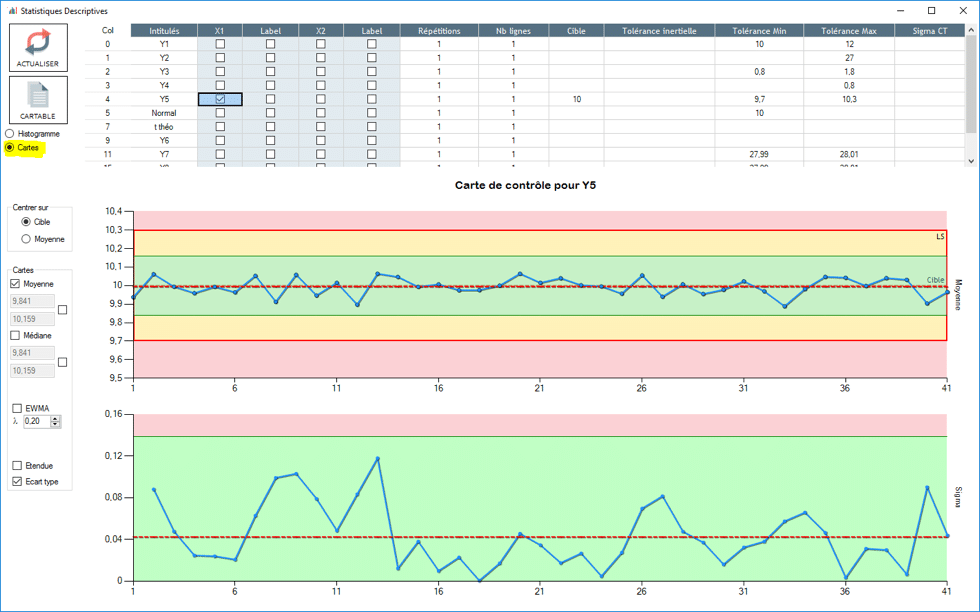
To access the control chart, open "statistical description/details" and click on "chart"
Mastering a process means mastering the variations of this process over time; Indeed, during the use of this process, numerous factors will have a modified state (tool wear, material modifications, operator changes, etc...) This will inevitably have an impact on centering the variability procedure. This is why we regulate the process at the beginning of production, to get as close to the target as possible.
We use the control chart to regulate the machine to only what is necessary; The control chart is a tool that allows you to follow the development of a short term process and to react if there is a centering deviation or dispersion detected.
When regulating a process there are two traps to avoid:
- Over-regulating: over-regulation occurs when the process is modified too often; Actually, centering the procedure does not necessarily mean that all parts should be targeted: all the parts will never be centered due to the dispersion process.
- Procedure derivation: the piloted processes will derivate over time because of multiple particular factors (tool wear, operator change, procedure intervention...), you must be capable of re-centering the procedure if a derivation is detected.