User Guide
Dispersion
The standard deviation is a good characteristic of normal distribution on the mathematical plan, but it is not really intuitively equivalent. We therefore prefer to use the term "dispersion" that corresponds to:
Dispersion = width of the interval value within which we observe 99.73% of values.
With a normal distribution the dispersion is calculated simply
The concept of dispersion is much more intuitive than standard deviation. Let us take the example using the following data. An observation of 1000 pieces of data in a normal distribution with an average of 0 and standard deviation of 1:
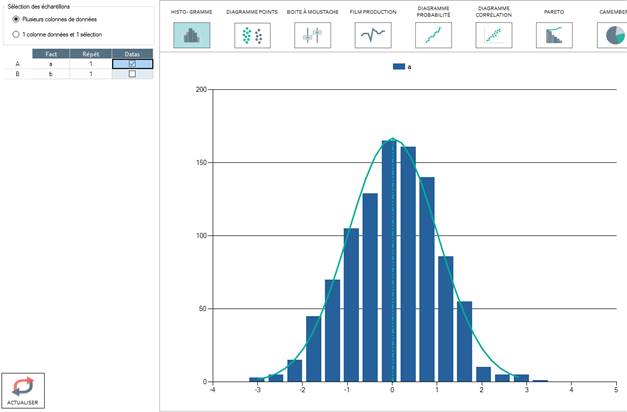
If we want to intuitively characterize the dispersion of these values, we would be tempted to say that the value dispersion is around 6 as the observed values are limited between -3 and +3.
Our intuitive definition of the dispersion actually corresponds to the sample range (Range= Max - Min). However, using the range as a characteristic of a distribution has no statistical direction. Actually, the normal distribution varies from -infinity to +infinity making the range of this distribution infinite.
The dispersion corresponds to the intuitive definition of the dispersion all while having a statistical direction. This is an interval within which we will observe practically all the values, i.e. 99.7% of values.