User Guide
Analyzing the results of a design of experiment
Conducting tests
You can access the tests by pulling up the spreadsheet
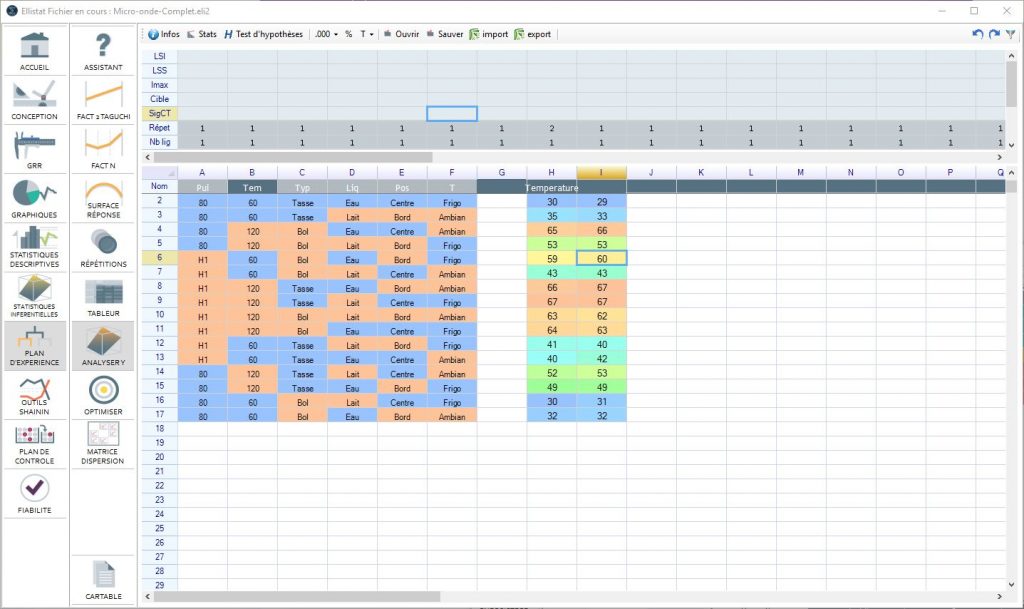
The test results are input anywhere you want in the spreadsheet
Conducting a test consists of inputting the results in the design of experiment In the vent that there are test repetitions, input several contiguous columns. The title for the response should be entered in the first column if there are repetitions.
If the plan has several results that need to be optimized, enter the same number of columns as number of results.
Design of experiment analysis
Click on the "Analyze" button, a window will open allowing you to choose the X and Y for analysis. Select the result in the Y column to be analyzed.
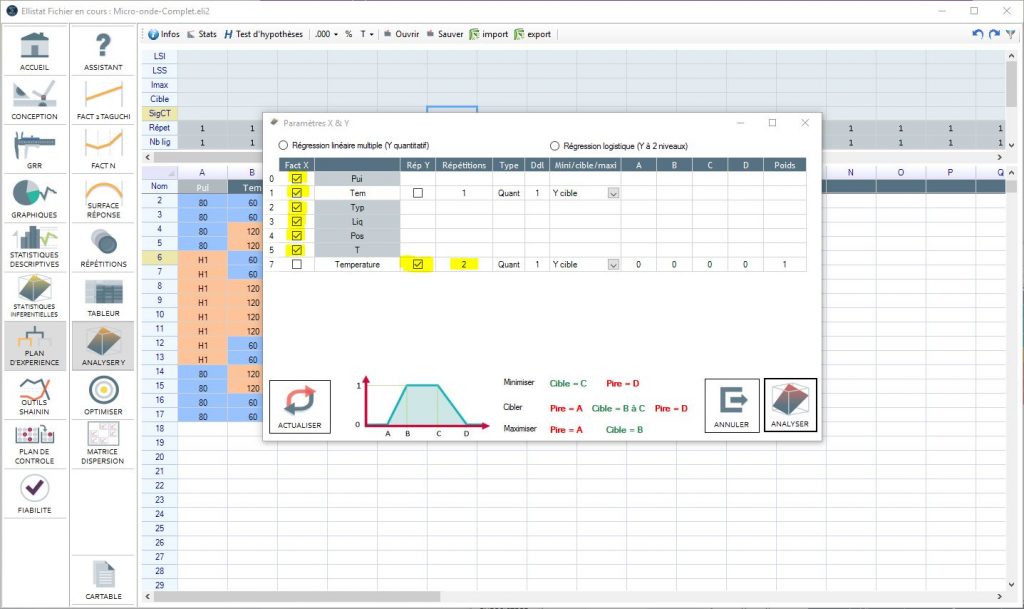
The number of repetitions (columns to be considered) should be entered. There is also an option to enter the result that you wish to analyze. In the example above, we want to target one result out of 23 equal to at least 20 but not more than 25.
Launch the analysis by clicking on "Analyze".
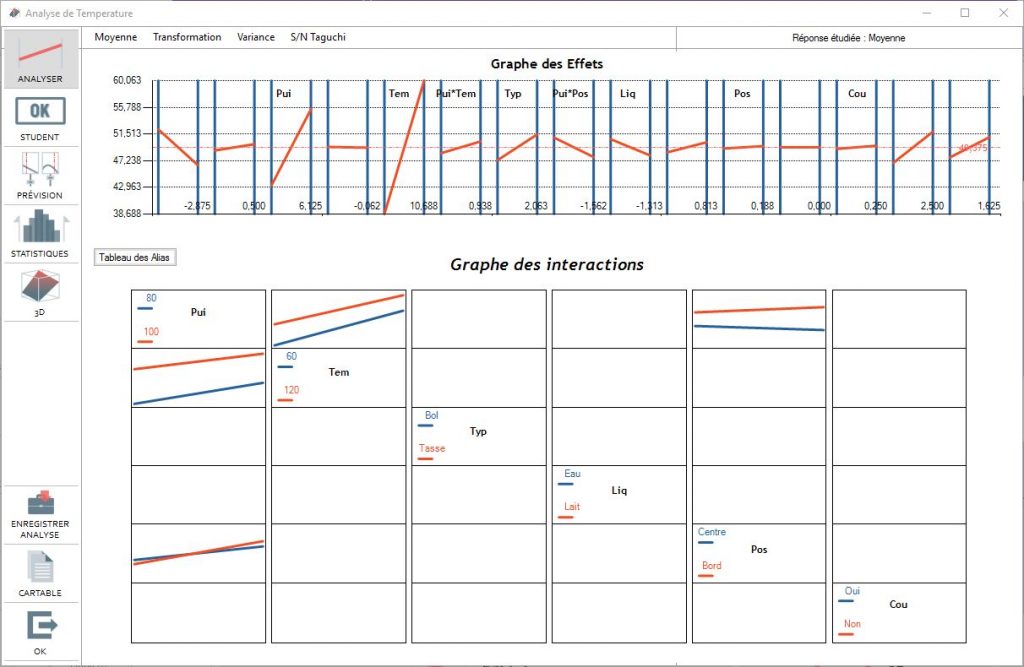
Effects graph
(Only available for Taguchi plan)
By default Ellistat shows the effects graph over the average results entered in the "testing" phase. The result to be analyzed can be modified by clicking on:
- Average: To analyze the average results
- Transformation: To analyze the Log (Y) =…. or Exp (Y) =… or Root (Y) = .....effects
- Variance: To analyze the effects of factors on the Y variant
The effects graph shows the effects on all the columns of the selected table. This eventually shows the interactions that were not selected at the beginning.
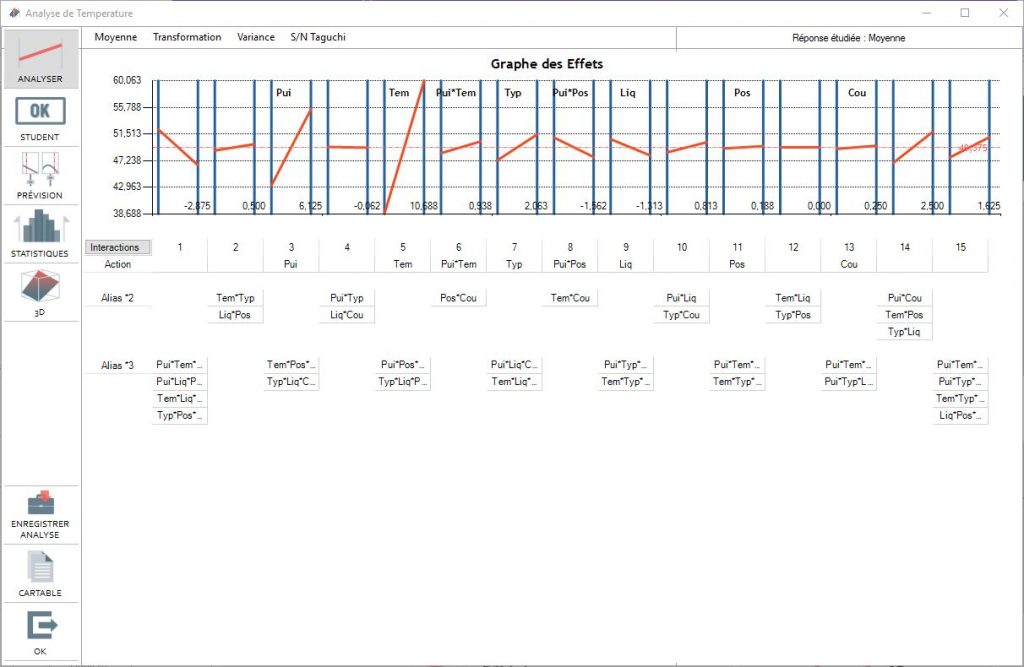
It is therefore possible to see an interaction that we hadn't considered or that would not be significant in the corresponding Taguchi column. You can then click on the interaction to open the model.
You can then see the interactions graph by clicking on the "interactions" button
Student - Significance analysis
Interpretation consists of exploiting the various analysis windows and, in particular, analysis of the significance of factors by using the Student test.
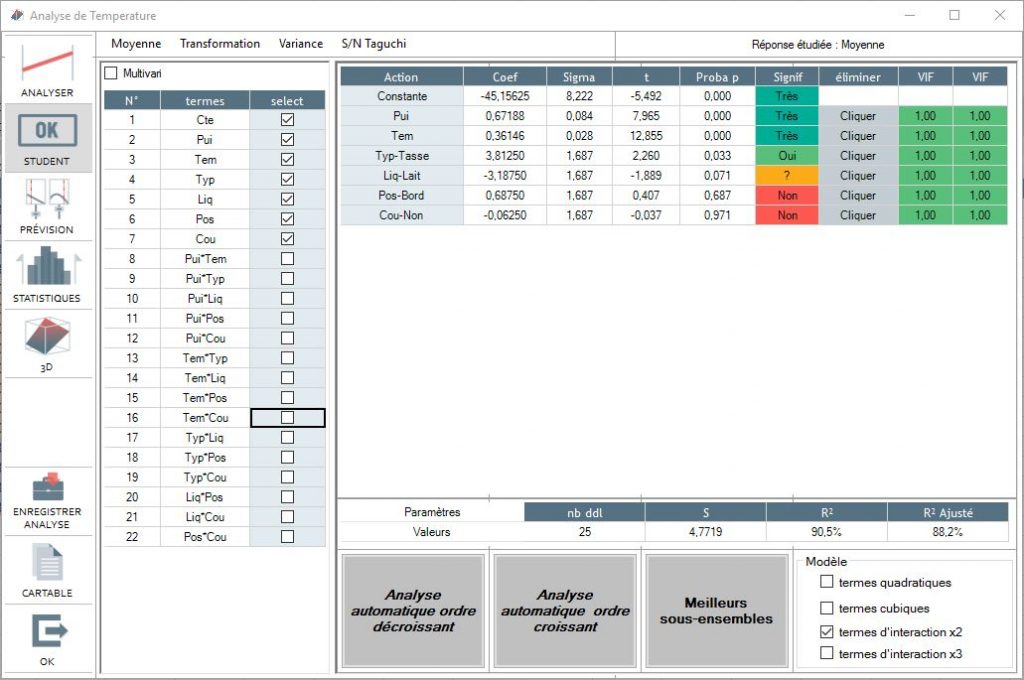
This menu shows the significance of all the factors (Signif column) as well as its degree of significance (Proba p column). The weaker the Proba p is, the higher the probability that the factor will truly be influential on the result. A factor is considered significant if:
If the coefficients are not significant (red) then we can delete them from the mode by clicking on the "clicker" in the line to be deleted. The analysis is then restarted. The list of "study-able" factors is in the left column. To adjust a factor, select the factor by clicking on the "select" box
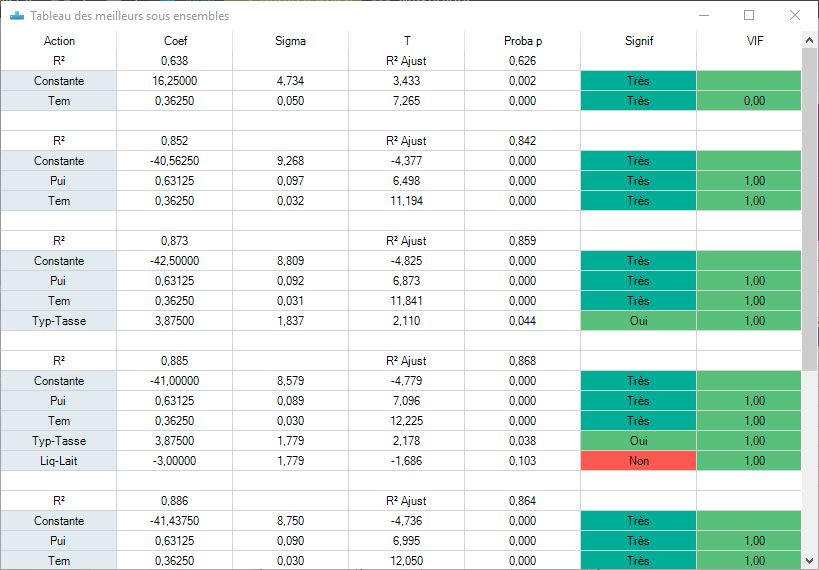
Good practice includes searching for the best model by simply using first order effects. To do this, click on the "best subsets" and enter the maximum number of X to be tested to obtain:
You can also do two studies: in descending or ascending order.
The descending order study consists of eliminating factors one by one to obtain only significant factors. They are eliminated in the following order:
- In the order of the variant inflation factor if the VIF >10
- followed by elimination by factor significance. Then the least significant (those with the highest probability p) except for the constant.
This analysis is made automatically.
The model is thus refined to obtain the results in our example at:
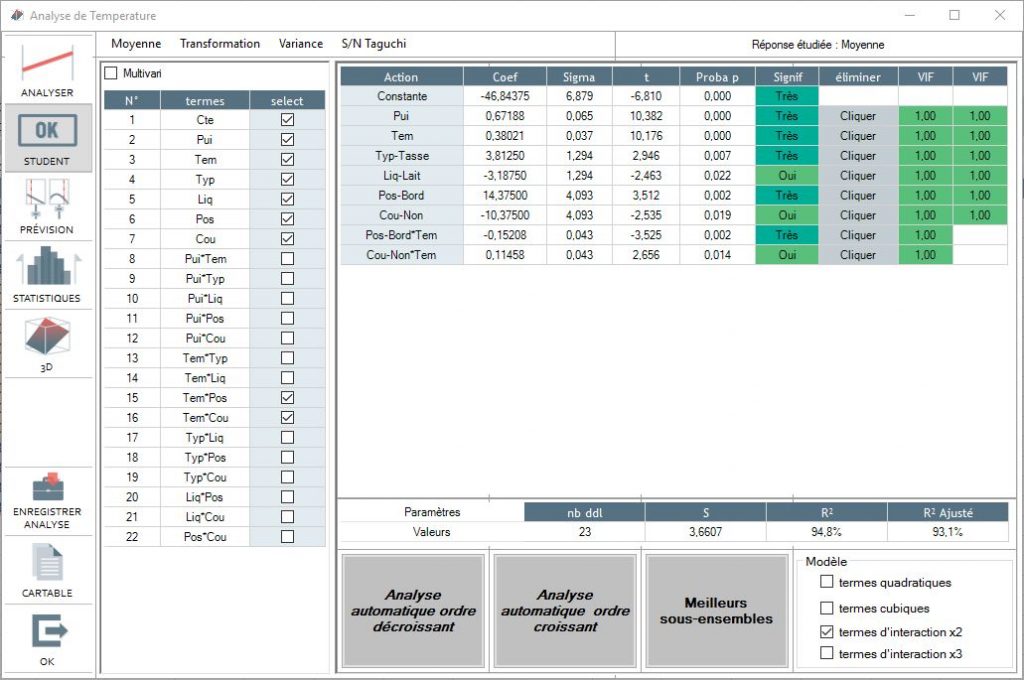
The adjusted R ² gives the percentage of the observed variations in the experimental plan explained in the model. The result in our example is 73.4%, which is correct.
By validating the "quadratic terms" the quadratic terms among the analysis candidates are eliminated or reset.
- Likewise with "interaction terms"
- Likewise with "cubic terms"
Prediction menu
This function allows Ellistat:
- to calculate a predicted response for a given configuration of factors.
- to find the degree of a factor in order to obtain the given response
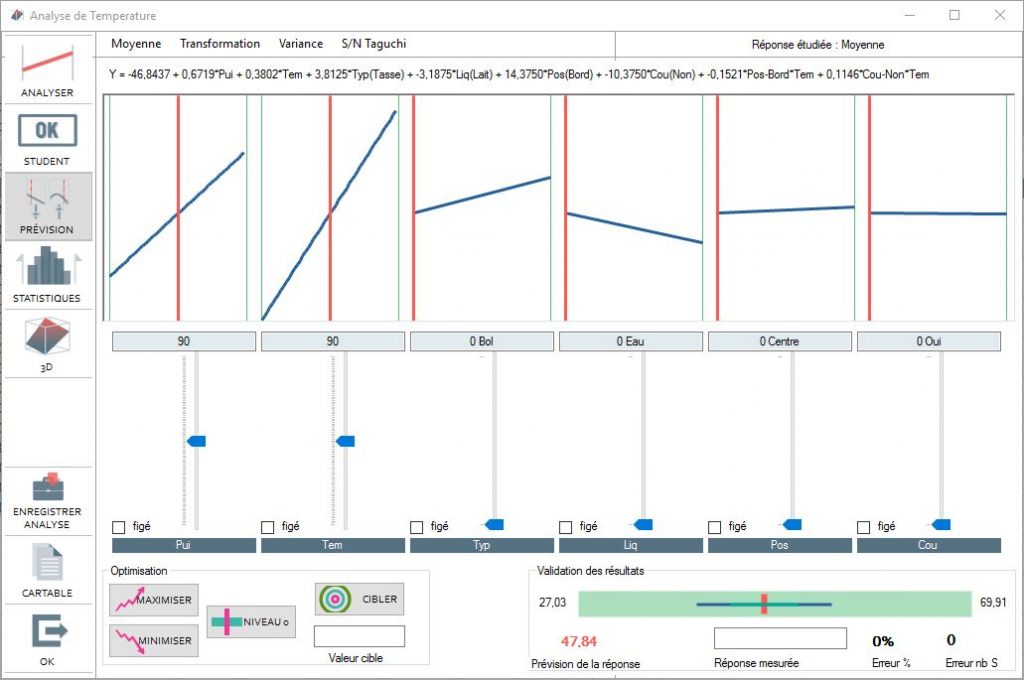
All that is needed in order to calculate a predicted response is to place the factor cursors on the retained degree and the calculation for the theoretic result will appear in the prediction box of the response.
To maximize or minimize the response, just click on the corresponding buttons. Ellistat automatically generates the best configuration.
In order to attain the result value by modifying a factor, enter the target value in the "target value" box and choose the factor to be modified to obtain said value. If the value can not be obtained in the variant range, Ellistat will generate the best result possible by placing the factors at the extremities. Another factor can then be chosen for modification.
For validation of the result, Ellistat will post the variant range of the prediction's possible results.
Ellistat will calculate the prediction error related to the variant range if you enter the value obtained during a validation test.
Generally, prediction errors of less than 10% are admitted
Statistics menu
Pareto
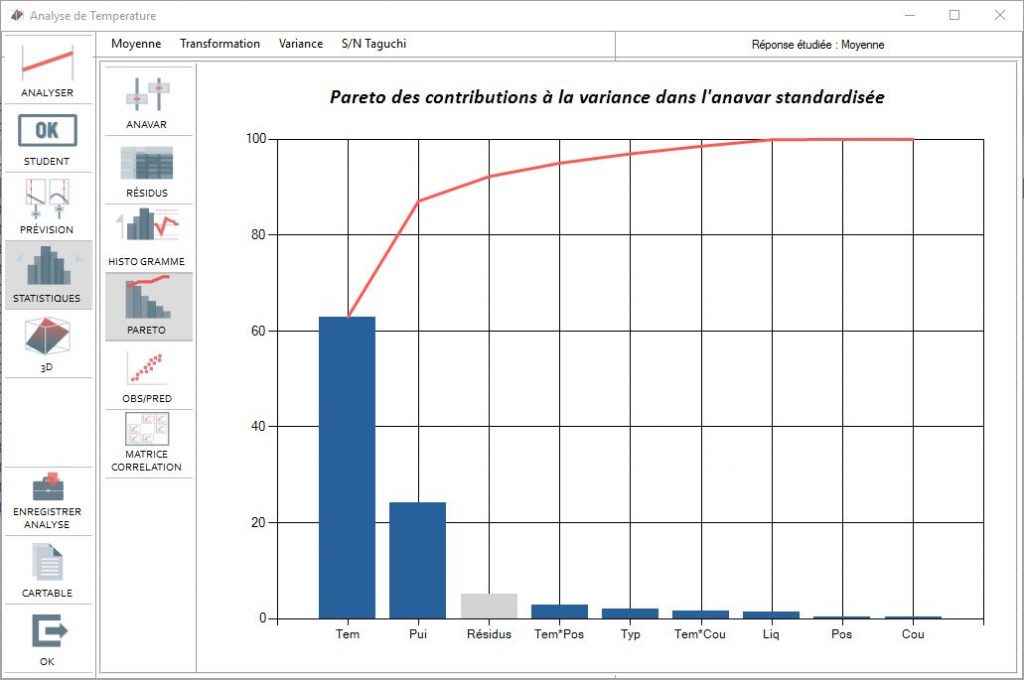
Gives the relative importance of factors in variant analysis
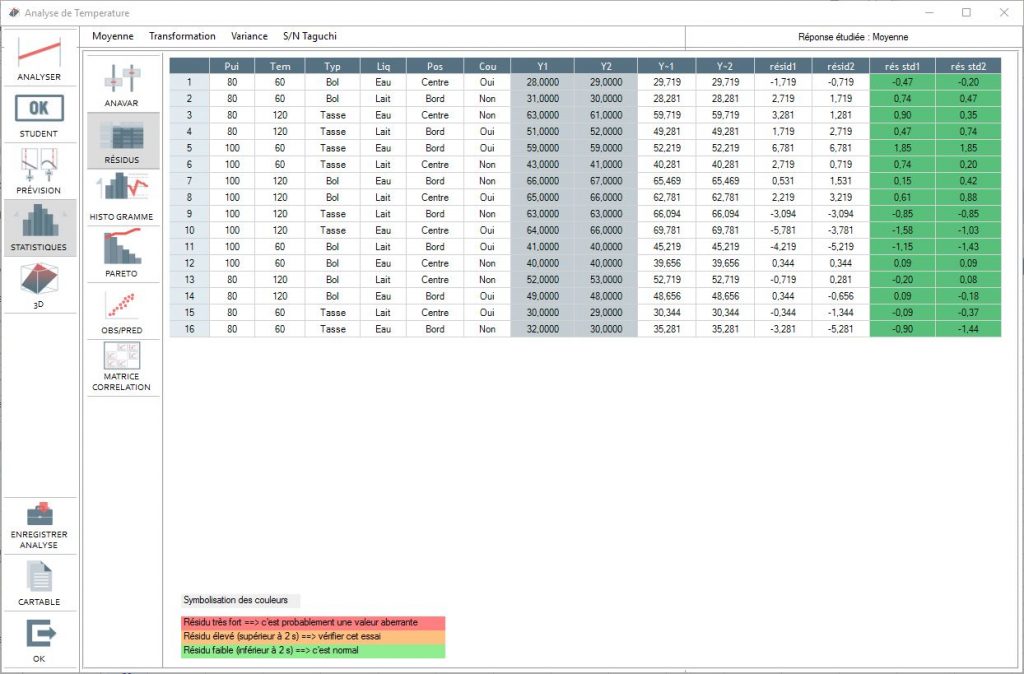
Residual
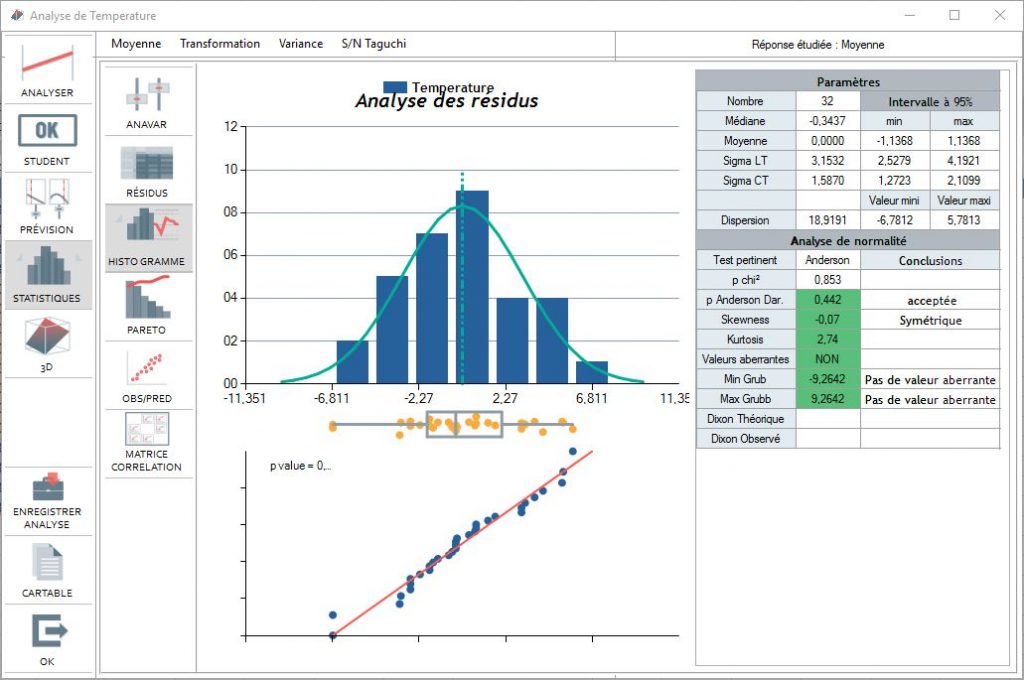
Residuals histogram
This diagram is particularly usefull when the number of residuals is above 15: it shows whether the distribution follows a normal distribution and the residual variance.
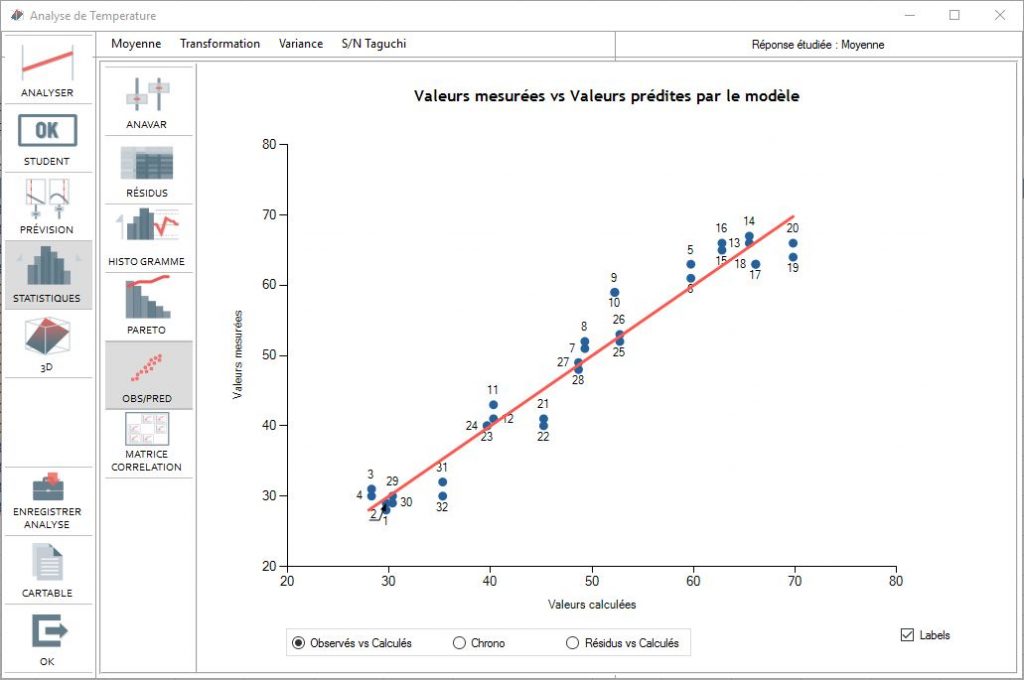
Observed vs Predicted
This diagram clearly whether the model obtained is correct for the tests being carried out. To do this a correlation is carried out between the value predicted by the model and the value measured during the tests. In theory, the points must align on the y=x line plotted in red
ANOVA
If several repetitions were carried out, the variant analysis can be carried out on the average result.
The analysis of this table is facilitated by the decision-making aid that appears in color.
The regrouping method can easily be applied to the factors by deleting and adding a factor in the variant analysis. To do this, click on the YES/NO in the "Retained" column on the line of the factor being considered;
However, be careful when interpreting it. The residual variant is calculated by taking into account the repetition variance of each line. In the event that a plan is made using Taguchi, the repetitions include the Noise factor effect variance. The residual variance is considerably overestimated in this specific case, declaring none of the factors as significant. Therefore, the results of this ANAVAR should not be taken into account in the case of Taguchi product plans.
If we know the residual sigma from another experiment than the experiment plan then we can enter the variant in order to carry out a variance analysis.
This table shows the results of calculations of factor and interaction effects. The averages are found when each factor is at level 1 or level 2. The average for each combination of retained interactions is also found.
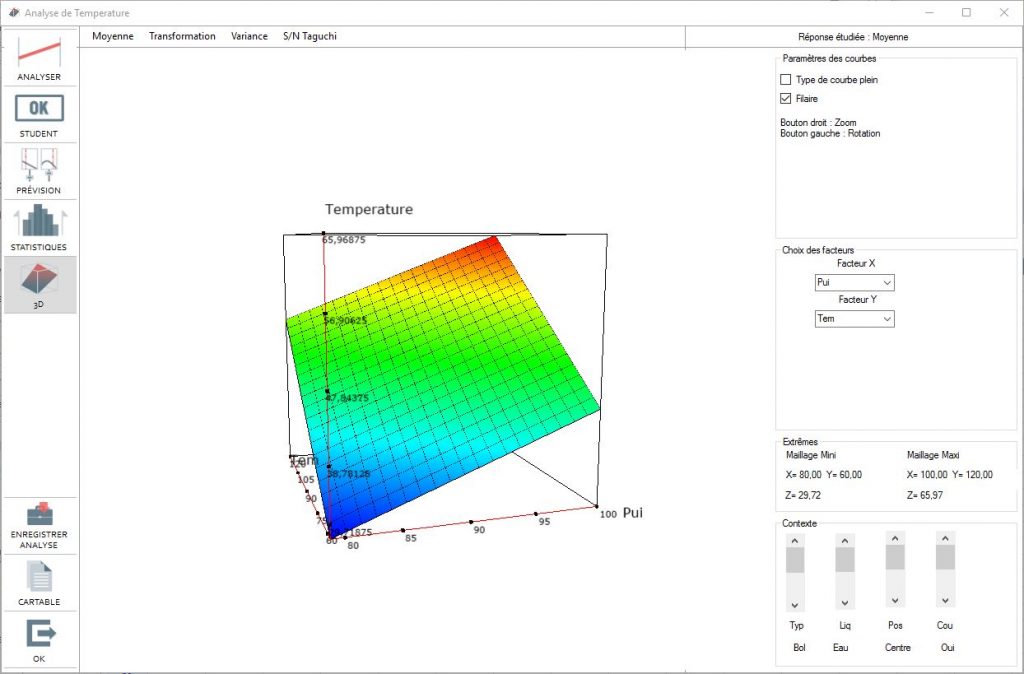
3D visualization menu
3D visualization helps us better understand how effects and interactions behave. Select 2 factors out of the total and a graph will visually represent the resulting surface for these two factors. You can then turn the image with the mouse.