User Guide
Details button
This button opens the following window:
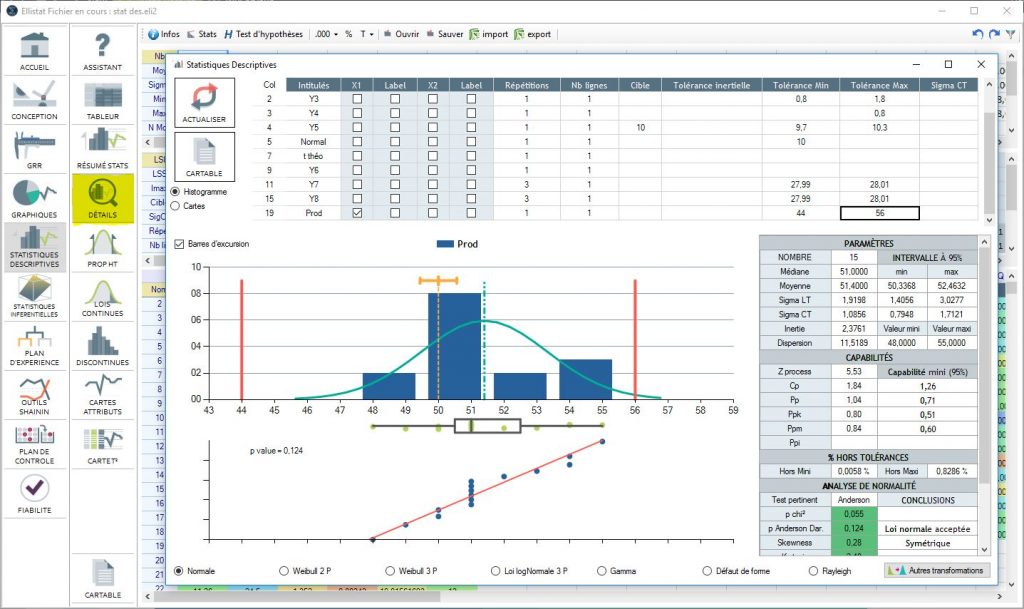
The histogram and complete analysis opens by clicking on the Histo button

By clicking on the Chart button you get the following chart:

Label
Allows you to select the column that will be used to show the control charts' x axes (date,batch n°…).
Repetition
If samples are entered in several columns (for example, a sample of 2 for Y6), then we put the sample size in the repetition column.
Nb lines
If the samples are entered in one column but you need to take samples by grouping the lines in 3's (example Y2), then we enter 3 in the number of lines.
Target
The default target is the centre of the tolerances. Another target can be defined.
Sigma (short term)
Used to calculate control charts The short term sigma is calculated by default from the samples. If it is not known it can be defined.
Cp, Pp, Ppk, Ppm
This analysis gives you the entirety of the capability analysis calculations.
Distribution law analysis
- Distribution parameters with their respective confidence intervals
- Capability indicators
- Off tolerance proportion calculation
- Normality analysis
Three graphs illustrate the analysis: a histogram with tolerances, a box plot and a probability diagram.
The default calculation is done according to normal distribution, but other distributions can be used:
- 2 or 3 parameter Weibull distributions
- Log normal distribution
- Gamma distribution
- Folded normal distribution
- Rayleigh distribution
When the normal distribution hypothesis is rejected (normal distribution rejected) then another law is chosen out of those proposed on the bottom of the sheet.
Other statistical transformations can be found by clicking on "other transformations".
The control chart
This analysis provides the control chart by mean/median and standard deviation/range. The EWMA chart is also available. The choice is made by selecting the charts from the panel on the left.
The testing parameters of the mean are shown in the green zone. Testing parameters in the red zone. An off tolerance value is shown in red. Any mean outside of the control is shown in red. The control charts can have variable sample sizes, the limits will be subsequently adjusted.