User Guide
Efficiency curve
When setting up a reception control statistic, you need to be aware that it is not possible to block 100% of the defects. The supplier and the customer should therefore agree on the level of acceptable quality, i.e. the average percentage of defects that the reception control can allow through.
The control efficiency curve aims to predict the control results according to the quality ratio of the batch being measured.
Let us take the following example:
A batch of 1000 parts is received containing 50 defects. The following reception control is established: 80 parts out of the batch are controlled, the batch is accepted if 1 or fewer defects is measured. If not the batch is rejected. According to descriptive statistics distributions we can show that (open descriptive statistic/discontinue):
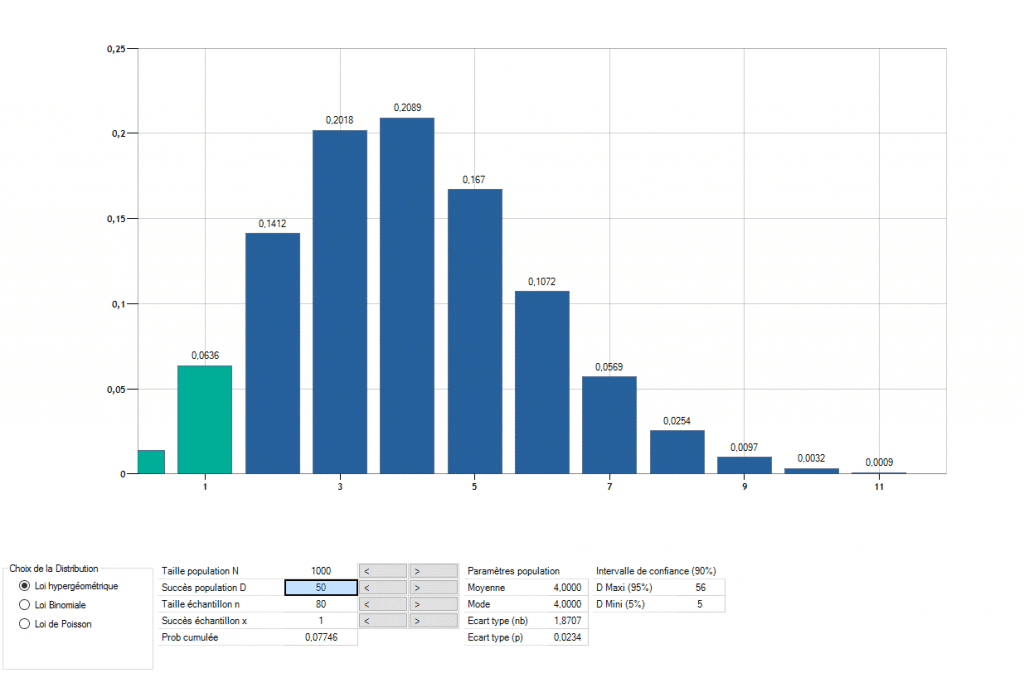
The probability of measuring 1 defect or fewer is 7.7%. Consequently, this batch has a 7.7% chance of being accepted and a 92.7% chance of being rejected.
We can therefore predict that, with a control of 80 parts and an acceptance level of 1 defect, a batch with 1000 parts containing 5% defects has a 7.7% chance of being accepted.
The efficiency curve therefore gives the acceptance probability of this batch for the entirety of the batches. The X axis of the efficiency curve is the percentage of defects in the batch. The Y axis is the acceptance percentage.
The following figure shows the efficiency curve the control of 80 parts and an acceptance level of 1 defect:
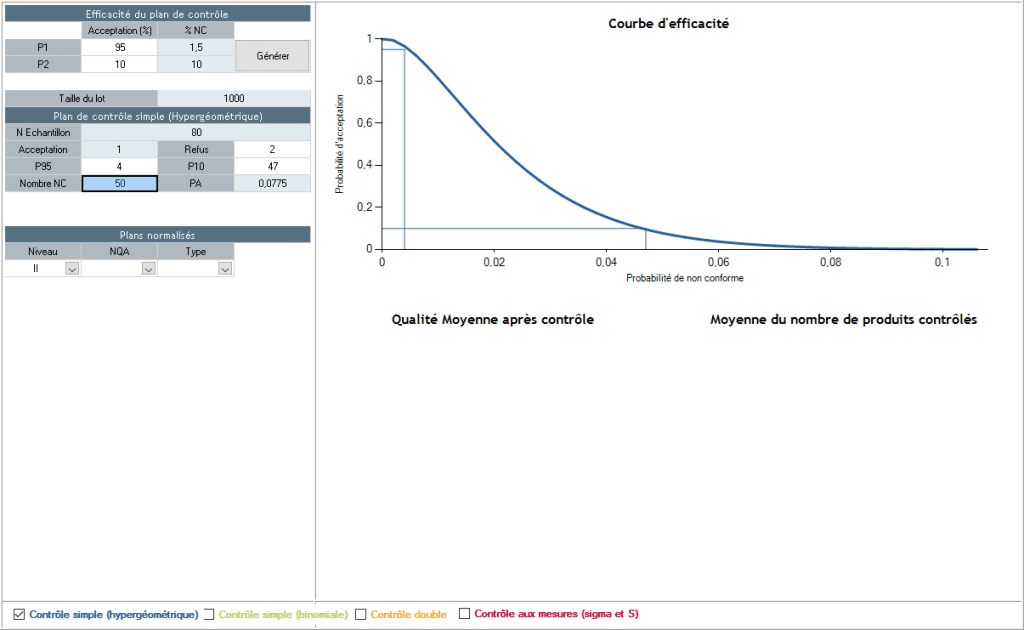
We effectively see that the acceptance level will be at 7.7% with 50 defects.
P95 and P10
We generally use two characteristic points on the curve to characterize it.
- P95 corresponds to the defect rate of a lot creating a 95% level of acceptance with the established control. In the preceding example P95 is 4, i.e. a batch containing 4 defects has a 95% chance of being accepted.
- P10 corresponds to the defect rate of a lot creating a 10% level of acceptance with the established control. In the preceding example P10 is 47, i.e. a batch containing 47 defects has a 10% chance of being accepted.