User Guide
Example 2 - k population comparison
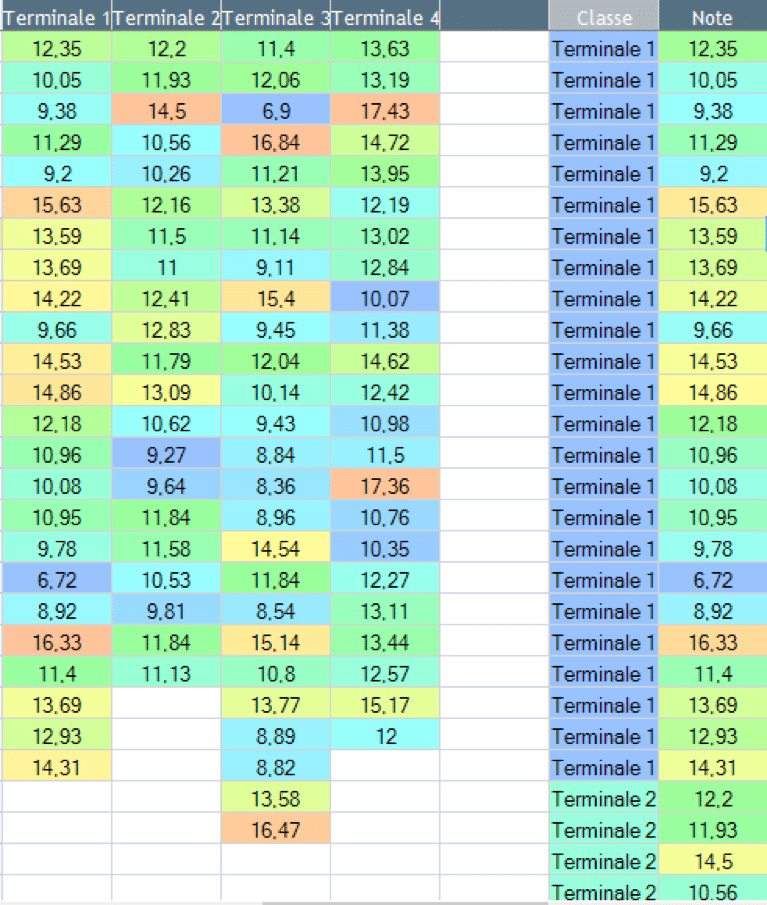
You have the maths grades for 4 senior classes. You would like to determine if these classes are homogeneous.

Which test do you choose?
Enter the data in Ellistat. The data can be entered in two different ways:
Then select the inferential statistics menu (on the left). In the adapted test selection menu (table at the top), select the columns containing your Y (the columns for the senior class here).
The inappropriate tests are now greyed out. To open the population comparison, select one of the k population comparison tests (ANAVAR, BARTLETT LEVENE, etc…) or the population comparisons:
Explanation
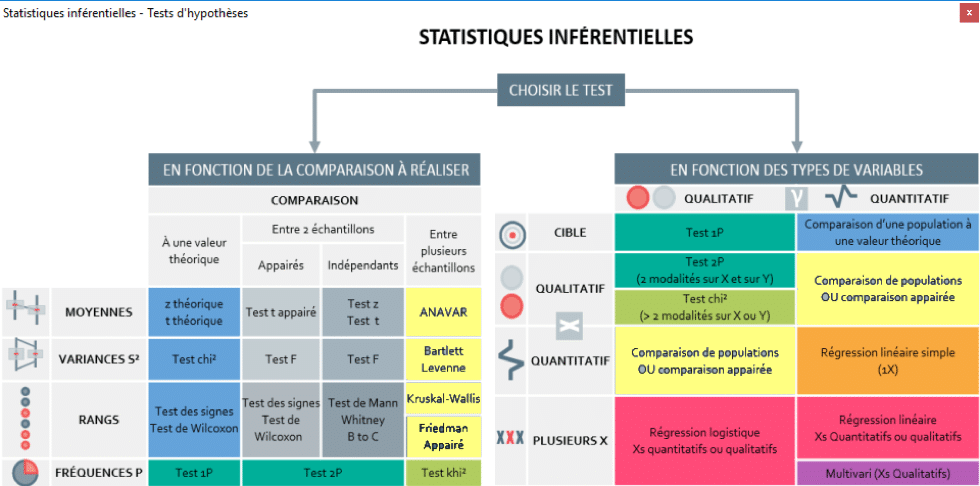
Left hand table: Depending on the comparison to be carried out: We want to compare the mean and the standard deviation for independent k samples, therefore ANAVAR and BARTLETT/LEVENE are used.
Right hand table: Y is the value of a grade between 0 and 20 (quantitative) depending on (X) the type of class (qualitative), this is therefore a population comparison.
Result :
All you need to do is select the type of data available to you in the table on the left and the following result is obtained:
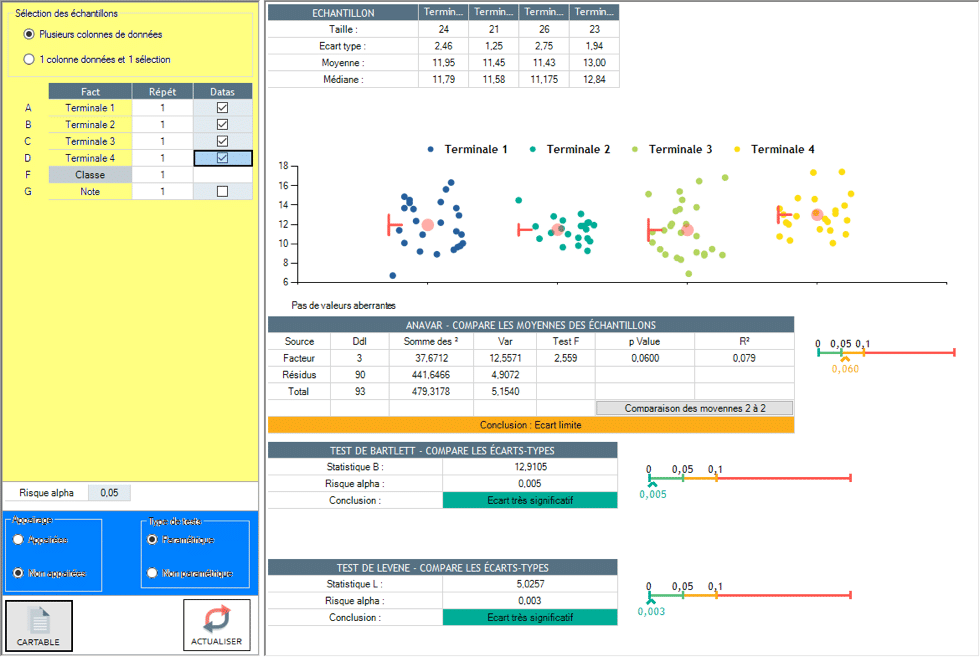
According to the results of various statistical tests:
ANAVAR, which makes it possible to compare the averages of different classes, shows the comparison of averages as insignificant (significant limit). We can therefore not conclude that the averages are different.
The BARTLETT and LEVENE tests, that make it possible to compare the different classes' standard deviations, show a comparison of the standard deviations as very significant.
Conclusion
Therefore, there surely is a difference in homogeneity between the classes because at least one class does not have the same dispersion as the others.