User Guide
Gage R&R
The Gage R&R is used to qualify a measurement process, i.e., to verify that the variability of the measurement process is compatible with the variability of the quantity being measured.
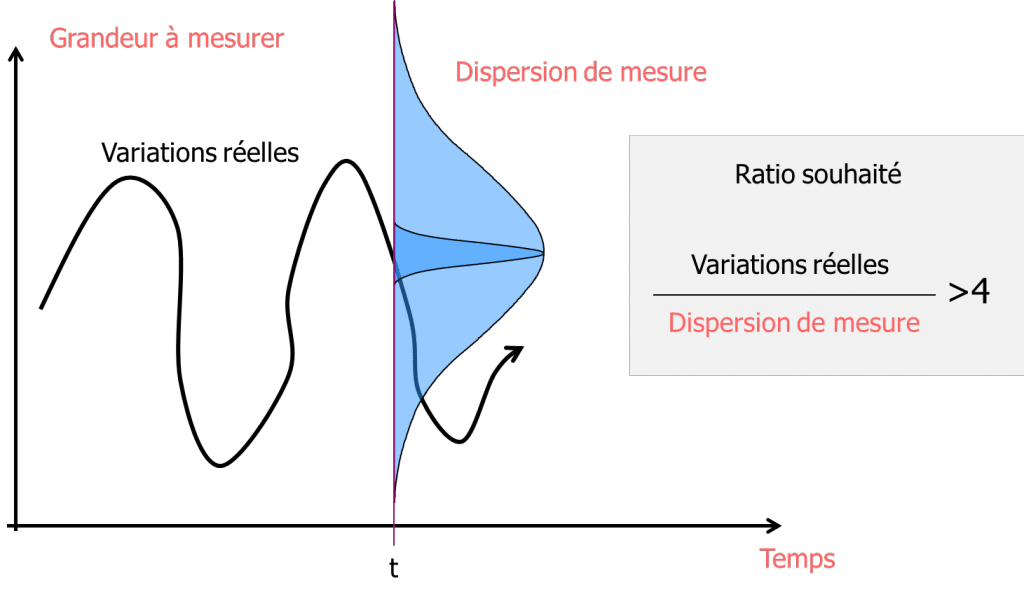
It is considered necessary to have a ratio of 4 between total part variability and total measurement variability. This ratio is expressed as Cpc production:
) > 4)
The Cpc production depends on the total part variability, but when we want to characterize a measuring instrument, we would like this characterization to be independent of the variability of production. We are therefore going to introduce a new type of variable, which allows us to characterize the measuring instrument not in relation to the total part variability but in relation to the tolerance interval of the parts.
In the same way that we calculate a capability, the measuring instrument will be characterized:
- Either by the Cpc (Control Process Capability):
) > 4)
- Or by the RR (Repeatability and Reproducibility) :
) > 25%)
As you can see, the two indicators represent the same thing and we have the relationship:
So here are the rules usually accepted:
| Cpc | GRR% | |
|---|---|---|
| Unacceptable | <3 | >30% |
| 3 and <4 | <30% and >20% | |
| Acceptable | >4 | <20% |
| Excellent | >8 | <10% |
Ellistat Usage:
To perform R&R, the number of parts, number of operators, and number of repetitions are defined to size the array. The calculations are performed when the array is complete. It is possible to change the number of parts, operators and repetitions after having entered the values.
If you place the mouse over a number, a brief reminder of the meaning of that number is displayed.
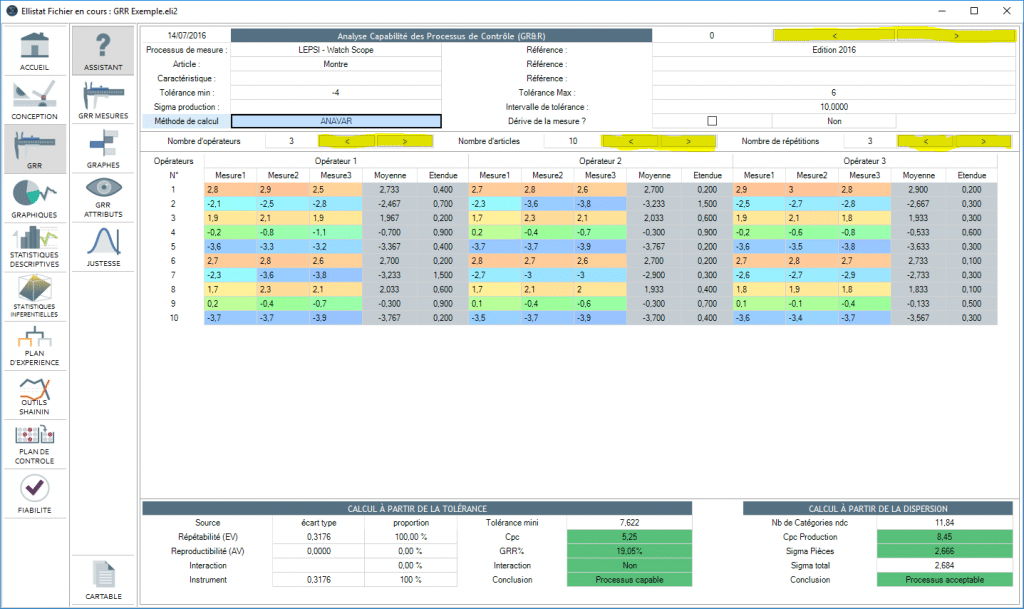
Several R&Rs can be performed in the same Ellistat session. You can switch from one R&R to another by clicking on the arrows
Interpreting the graphs :
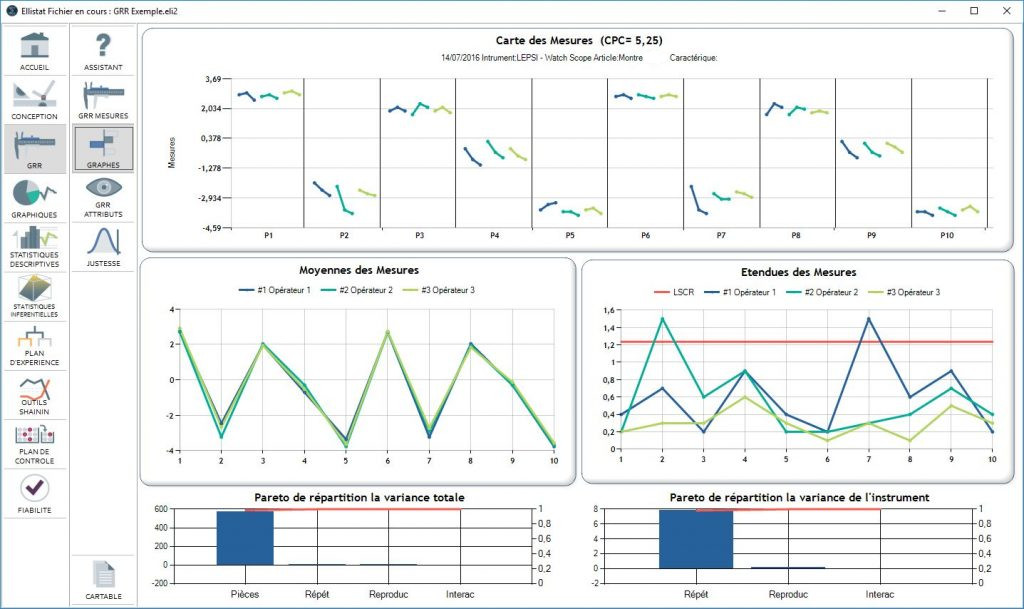
The graphs give us visual information on the result of the calculations.
The first graph gives for each part measured and each operator the repetition of the measurements made.
The second line of the graph gives the average of the measurements per part and per operator as well as the range map. An out of control point on the range map probably means an outlier.
Finally the bar graphs give the distribution of the variance.