User Guide
Hypothesis test
Ellistat has a unique statistical test module making the highest number of statistical tests possible without being an expert in the field.
The Hypothesis test menu can be directly accessed by clicking on "Inferential statistics" or the Alpha/Beta button.
.
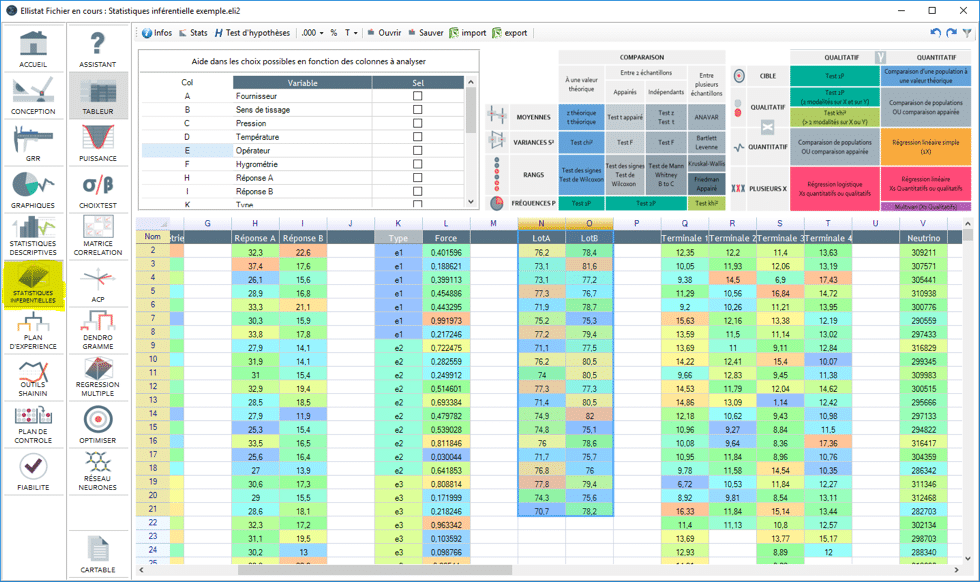
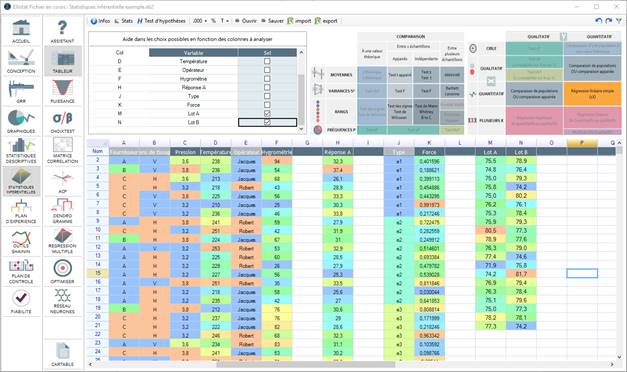
This will give you access to the table below:
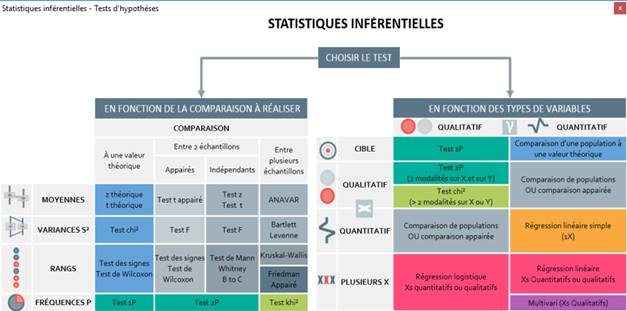

The table will help you choose statistical tests that you can launch.
Test choices
The table has two parts that both allow accessto the same test statistics (the colour of the boxes corresponds to the test that will open, the same colour brings you to the same place). You can then choose the table that you would rather use.
Left hand table: Depending on the comparison to be carried out :
The left hand table gives you access to the desired test when you know which type of comparison you would like to carry out.
When using this table you need to ask yourself:
How many samples do I have?
- Only 1 sample to be compared with a theoretical value.
- 2 samples to be compared with each other
- Paired: the lines in the samples are to be compared in pairs (two by two)
- Independent: the samples are completely independent
- More than 2 samples to be compares with each other
Which type of comparison do you wish to make?
- Mean: to determine if the sample mean is different between samples or against a theoretical value.
- Variance: to determine if the standard deviation or dispersion is different between samples or against a theoretical value
- Row: if the data available does not follow normal distributions and we want to use non-parametric tests
- Frequency: to determine if an appearance frequence (ex: defect ratio) is different between samples or against a theoretical value
Example:
You received two batches of products from two different suppliers. The product output for these batches was measured and you would like to know if one of the suppliers would allow you to obtain better output. Here are the measurements that were taken:
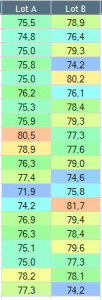
How many samples do you have?
Two independent samples
Which type of comparison do you wish to make?
a comparison of the mean of the two samples
According to the left hand table the suitable test is test z or test t. Just click on the test.
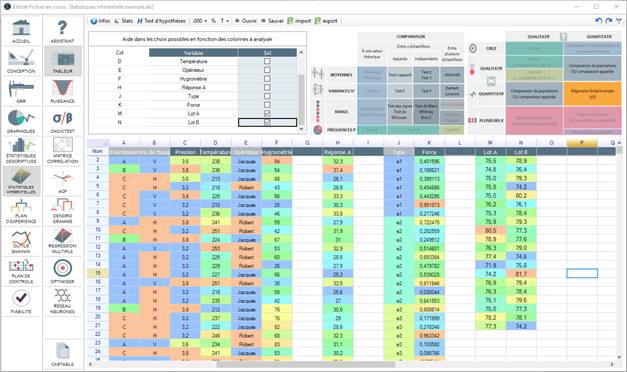
To make the choice easier we could have selected the two columns that we want to compare and Ellistat would limit the choices to only those tests possible for these two columns:
Right hand table: depending on the type of variable:
The right hand table gives you acess to the desired test when you know the type of variable you would like to compare.
When using this table, ask yourself the following question:
What type of Y do I have?:
- Qualitative: i.e. a non-measurable value. For example OK/KO.
- Quantitative: i.e. a measurable value composed of at least 5 different values. For example, an output measurement
What type of X do I have?:
- Target: if we want to compare a sample against a theoretical value.
- Qualitative: i.e. a non-measurable value. For example OK/KO, Supplier A/Supplier B, With additive/Without additive, Before modification/After modification etc…
- Quantitative: i.e. a measurable value composed of at least 5 different values. For example, a pressure or temperature measurement.
- Several X's: if we want to model the result Y based on several X variables.
Example:
You received two batches of products from two different suppliers. The product output for these batches was measured and you would like to know if one of the suppliers would allow you to obtain better output. Here are the measurements that were taken:
What type of Y do I have? Quantitative: this is a measurement of output
What type of X do I have? Qualitative: this relates to the type of supplier (Batch A or Batch B)
According to the right hand table the population comparison should be done, just click on it.
To make the choice easier we could have selected the two columns that we want to compare and Ellistat would limit the choices to only those tests possible for these two columns:
Carrying out the test
Once the test has been launched the following window will appear:
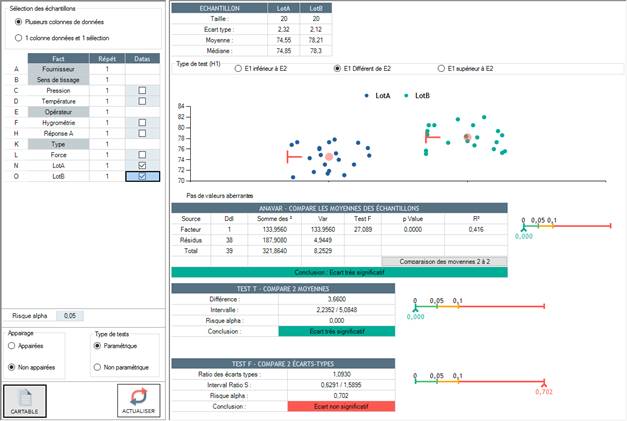
We therefore observe that the two mean comparison tests, the ANOVA and test T tests, show that the means are very significantly different. We can thus conclude that supplier B would allow us to attain a higher output.