User Guide
Individual values chart
The Shewart principle is used whenever following a process supported by a control chart.
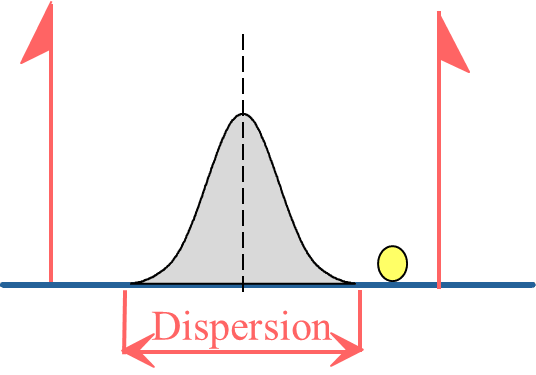
The process is considered perfectly centered and the only possible variation is due to short term procedure variations. If the process is actually perfectly centered, in this case 99;7% of the parts will be produced inside the procedure dispersion, i.e. + 3σ with normal distribution. The defined limits will thus will be called control limits.
When a part is produced two situations can occur:
- Within control limits: whenever a part is measured that falls within control limits, then the hypothesis of the perfectly centered process is completely verified. No further action is required.
- Outside control limits: whenever a part is measured that falls outside of the control limits, then the hypothesis of the perfectly centered process is not verified. The process must, therefore, be adjusted.
Ellistat use
To open an individual values chart, enter the data in only one column and open the averages chart. As the data has only been entered in one column, the chart that appears will be an individual values chart.
