User Guide
Multi-vari
The multi-vari makes it possible to highlight the main contrasts at the source of a problem.
To use the multi-vari, the data must be put in the following form:
A column of data containing measurements, one or several columns containing the possible causes.
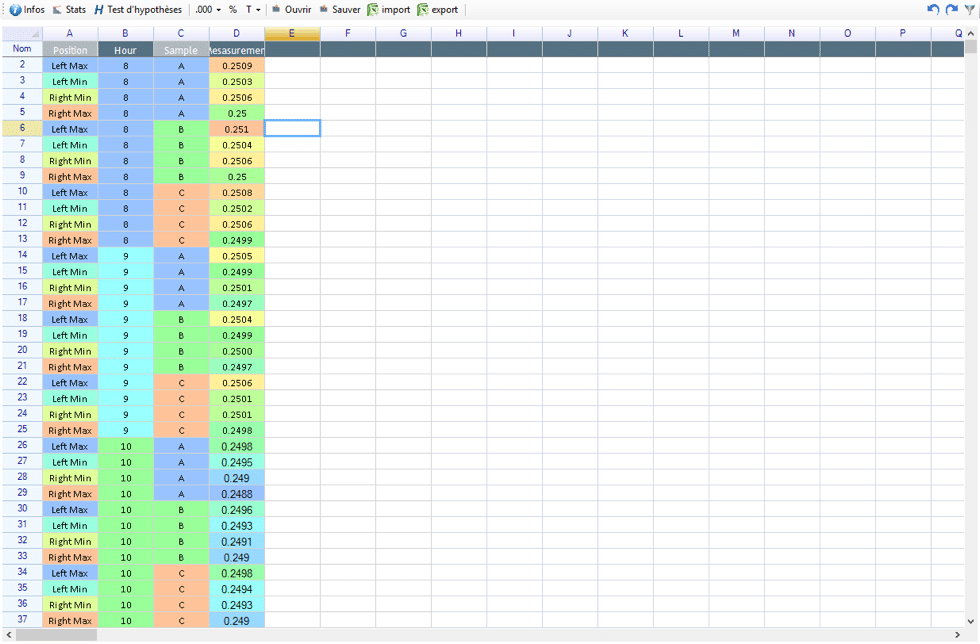
In the preceding example, the "Measurement" column corresponds to data while the other columns contain possible causes. Data was recorded over a half a day, taking 3 samples per hour. For each product several measurements were carried out and 4 points were recorded corresponding with Left Min, Left Max, Right Min, Right Max.
The following figure was then obtained:
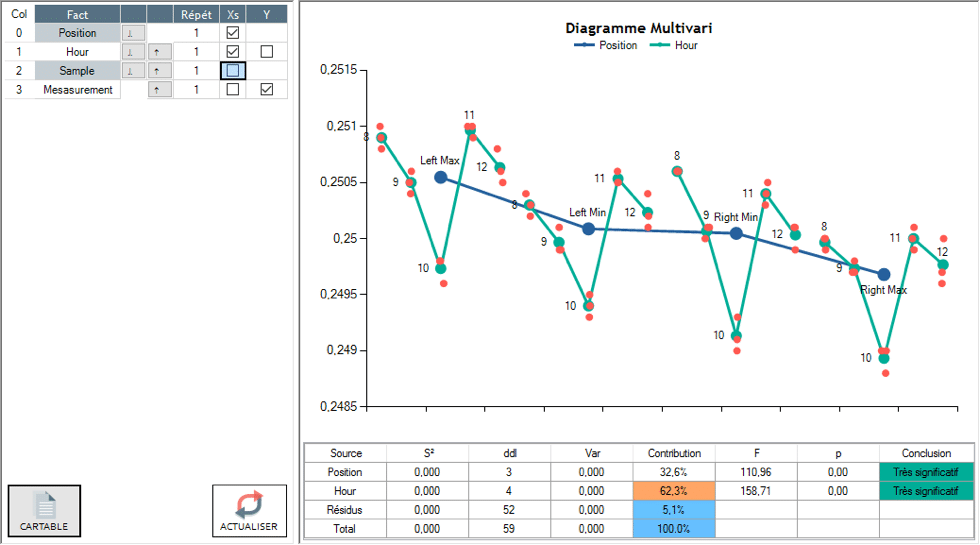
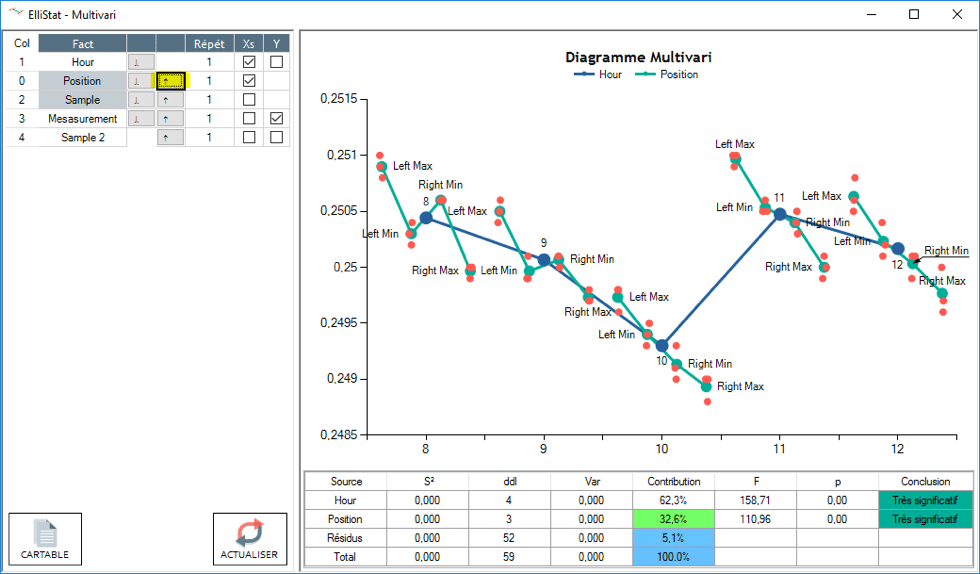
It is better to put the factors with the most significant contribution first, to make reading the figure easier. Click on the corresponding arrow to obtain:
We therefore read:
- 62% of the variance is due to the “hour” factor. We therefore notice that there is a constant measurement decrease between every hour except 10:00 and 11:00, where there is a significant increase.
- 32.6% of the variance are due to the “position” factor.