User Guide
Weibull parameter estimation
Once failure tests have been carried out and data has been collected, we want to be able to characterize the Weibull parameters on the failure curve.
The following principle applies:
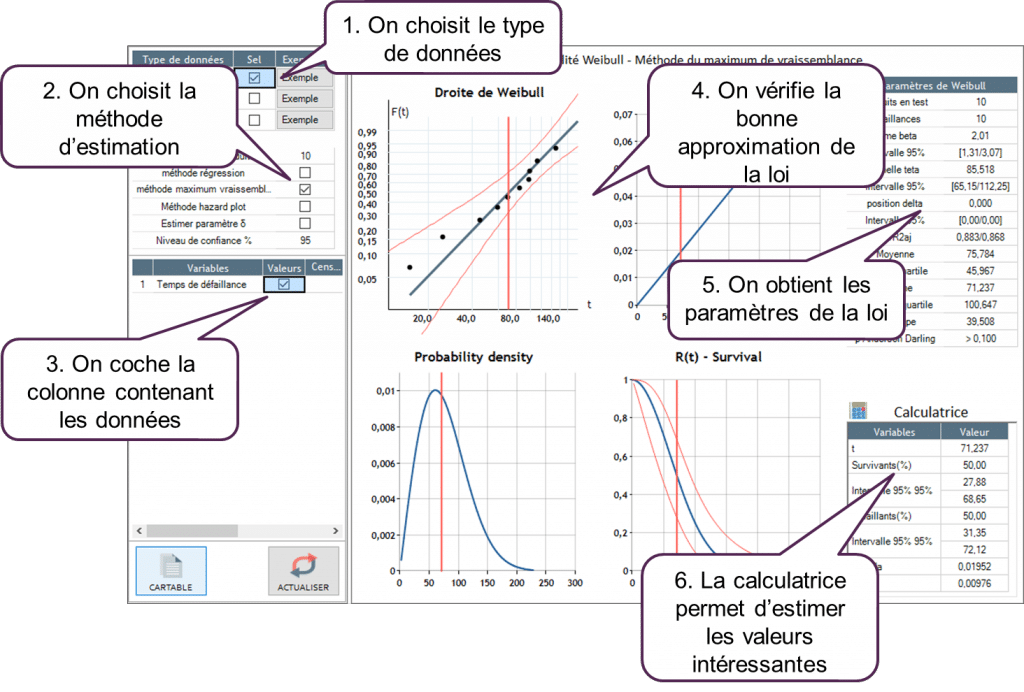
1. The type of data is chosens.
Ellistat provides 3 methods for entering failure data:
-
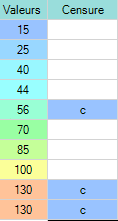
Values + Censures: you have a series of products that were tested and for which the number of cycles carried out before failure are known. In this case, enter the data in the following way: 1 column containing the number of cycles carried out by the product, 1 column containing the information "c" if the product was not in failure after this number of cycles
-
Periods + Censures: you have a series of products that were tested by period and for which the number of product failures between each period are known as well as the number of products having stopped the test without failure for each period (censure) are known. In this case enter the data in this way:
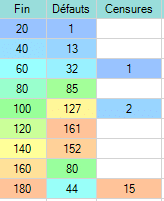
1 column containing the number of cycles at the end of each period, 1 column containing the number of failing products during the given period, 1 column containing the number of products having stopped the tests without failure for this period. (Censures) -
SAV returns :a series of products that were put on the market during different periods (per month) and for which the number of returns for these products during each period. In this case enter the data in this way

1 column containing the number of product sales for each period, followed by a column for each period for which you will indicate the number of failing products received within the period p.
2. Choosing the estimation method :
- Regression method: this method calculates the Weibull coefficients through linear regression in Log/Log.
- Maximum probability method: this method optimizes the Weibull coefficients so that the Weibull curve approaches the failure points noted in a non-logarithmic scale as closely as possible.
- Calculation parameter δ: by default, Ellistat will not calculate the curve's delay effect. It can be forced by calculating the parameter δ.
- Degree of confidence: allows for the adjustment of the degree of confidence with which the uncertainty curves are calculated in the calculator. The default degree of confidence setting is 95%.
- Check the column containing the data types:
- Verify the appropriate distribution approximation:
- the points on the Weibull curve should be close to the right side of the regression
- the Anderson-Darlin coefficient p should be more than 0.05
3. The parameters of the distribution obtained are :
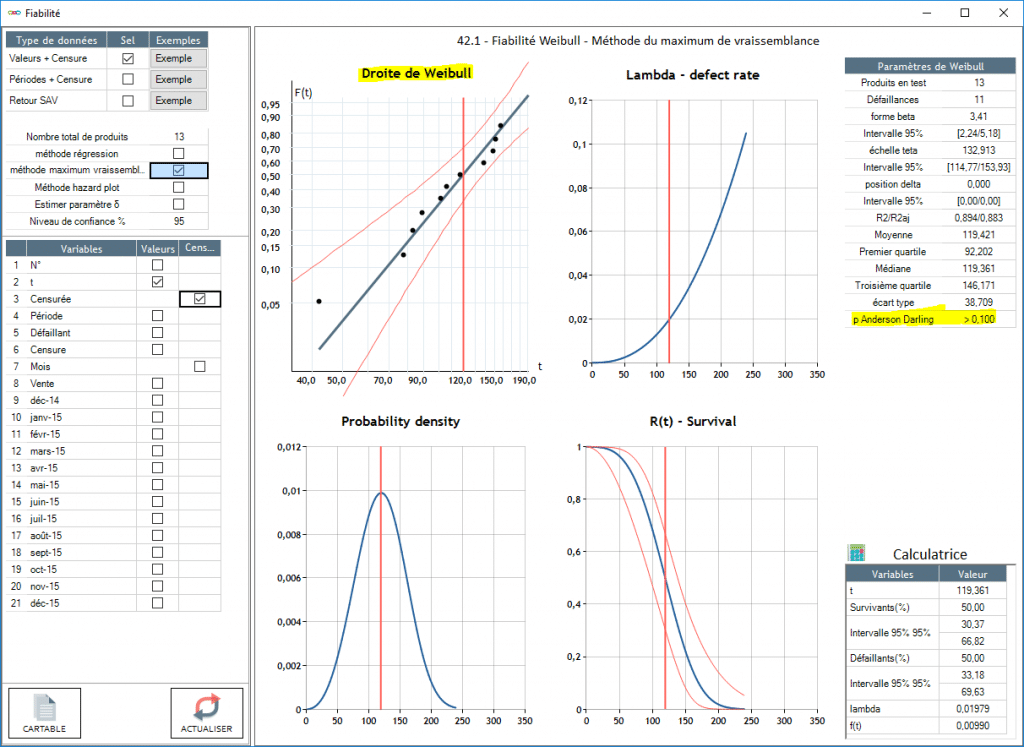
- The number of products being tested: the number of products already tested
- Failure: a number of products in failure
- Beta form: parameter β of the Weibull model
- 95% interval: confidence interval of the calculation of parameter β
- Theta scale: parameter θ of the Weibull model
- 95% interval: confidence interval of the calculation of parameter θ
- Delta position: parameter δ of the Weibull model
- 95% interval: confidence interval of the calculation of parameter θ
- R2/R2aj: calculation of the R2 and adjusted R2 This yields the quality correlation.
- Mean: corresponds to the MTTF
- First quartile: the number of cycles corresponding to 25% failure
- Median: the number of cycles corresponding to 50% failure
- Third quartile: the number of cycles corresponding to 25% failure
- Anderson-Darling p: yields the model quality. Desired result is p >0.05
Interesting values can be calculated thanks to the calculator. All the values can be modified and the other values will be calculated automatically.
- t: tested cycle time
- Survivor: % of survivors for the tested cycle time according to the Weibull model
- 95% interval: % of survivors for the tested cycle time with 95% confidence (upper and lower value)
- Failure: % of failures for the tested cycle time according to the Weibull model
- 95% interval: % of failure for the tested cycle time with 95% confidence (upper and lower value)
- Lambda: failure rate for the tested cycle time
- F (t): failure probability density for the tested cycle time