User Guide
Example 3: Comparison of 2 frequencies
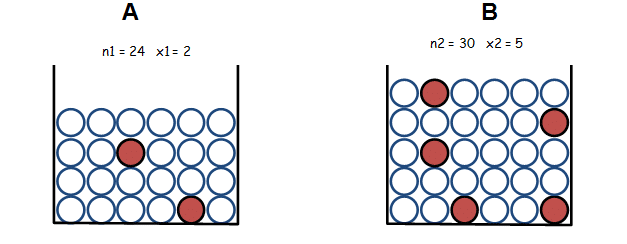
You received two batches from two different suppliers. The red parts represent the defective parts. The defect rate of supplier A is 2/24 and defect rate of supplier B is 5/30. With the data at your disposal, can you say that supplier a is significantly better than supplier B?
Which test do you choose?
Enter the data in Ellistat. Then select the Inferential statistics menu (on the left). In the adapted test menu (table on top), select the two columns containing your Y data (here supplier a and supplier B).
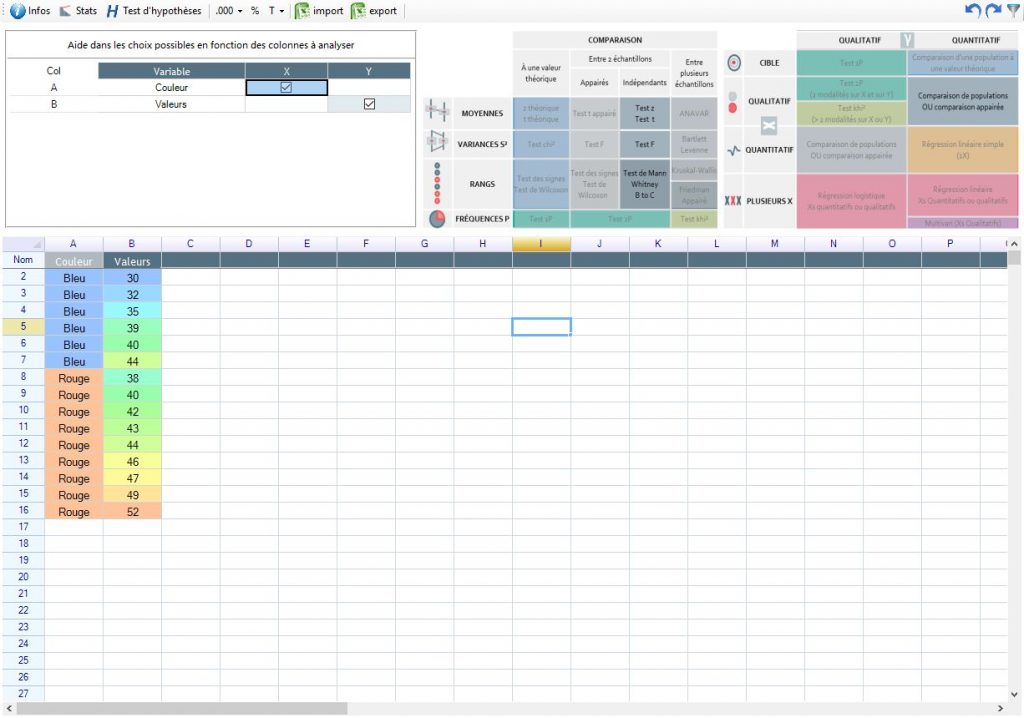
The inappropriate tests will become greyed out and the only choice left will be the 2P test.
Explanation:
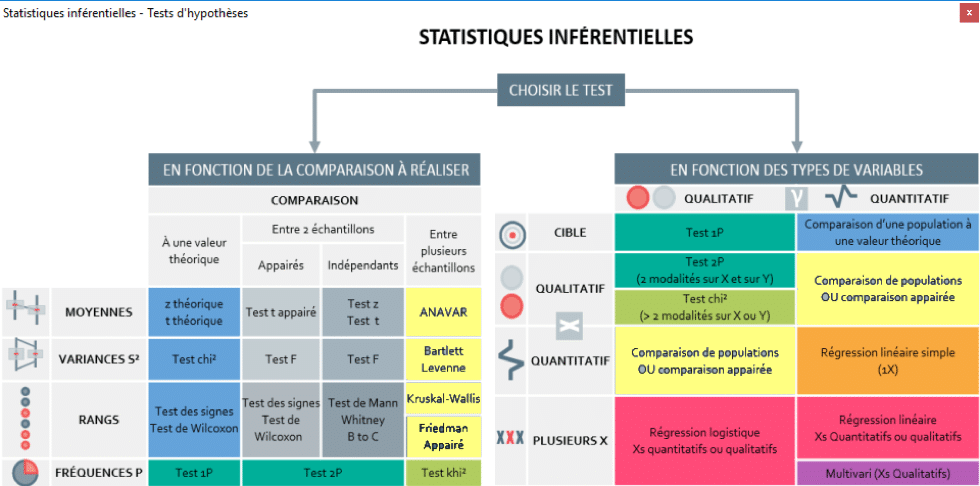
Left hand table- Depending on the comparison to be carried out: We want to compare the defect frequency between the two samples, therefore we use test 2P.
Right hand table - Depending on the types of variables:Y is the result of the OK/KO measurement (qualitative), dependant (X) on the kind of supplier, A or B (qualitative), therefore the comparison requires a 2P test
Result :
Enter the data from the 2 samples in the corresponding boxes.
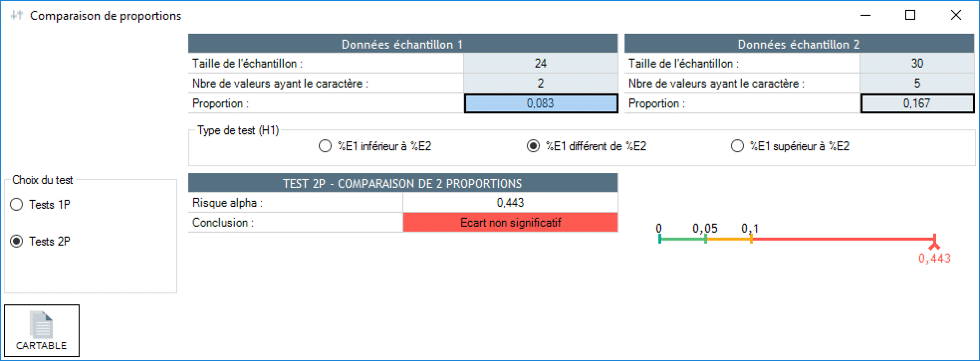
The difference between the two samples is not significant. This means that supplier A can not be considered to produce significantly fewer defects than supplier B. Contrary to our intuition, supplier A is not necessarily better than supplier B.